Bootstrap:Data Science
Unit 1Students are introduced to the Animals Dataset, and learn about Table, Categorical and Quantitative data. They begin to program as well, and learn about Numbers, Strings, Types, Operations, Contracts, and Function Application.
Unit 2Students continue to explore the Animals Dataset, and consider the kinds of questions that can be asked about a dataset. They also learn to define values, and to define functions using a structured approach to problem solving called the "Design Recipe". They then use these functions to filter the animals dataset, using methods.
Unit 3Students learn to prepare for analyzing a new dataset by considering logical subsets of that data. They begin with the Animals Dataset, and then apply what they’ve learned to a dataset of their own choosing. In the process, they practice using the Design Recipe to create filter functions, and come up with questions they wish to explore. The focus of this unit is categorical variables, and by the end students will know how to display categorical variables.
Unit 4Students explore new visualizations in Pyret, this time focusing on the frequency of observations in a quantitative dataset. They learn how to see the shape of a histogram, understand the difference between bar charts and histograms, construct histograms by hand and with Pyret, experiment with these visualizations in a contrived dataset, apply them to their own research, and interpret the results.
Unit 5Students learn how to evaluate two key aspects of a quantitative data set: its center and spread. They measure central tendency (using mean, median, and mode), as well as spread (visualizing quartiles with box plots). After applying these concepts to a contrived dataset, they apply them to their own datasets and interpret the results.
Unit 6Students continue practicing the Design Recipe, and learn how to build and transform columns in a table. They also learn how to chain methods together, and define more sophisticated subsets. Finally, they consider the concept of trust and testing - how do we know if a particular analysis is trustworthy?
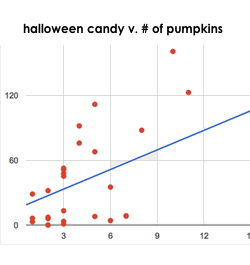
Unit 7Students investigate scatter plots as a method of visualizing the relationship between two variables, and begin searching for correlations in their dataset.
Unit 8Students compute the "line of best fit" using linear regression, and search for correlations in their own datasets.
Unit 9Students consider possible threats to the validity of their analysis